xAI
xAI Grok can now generate data charts
Grok has gained a new feature that allows users to generate charts of different data sets for better productivity. This feature is now available on Grok.com and only works through browsers, while support for the mobile app is coming soon.
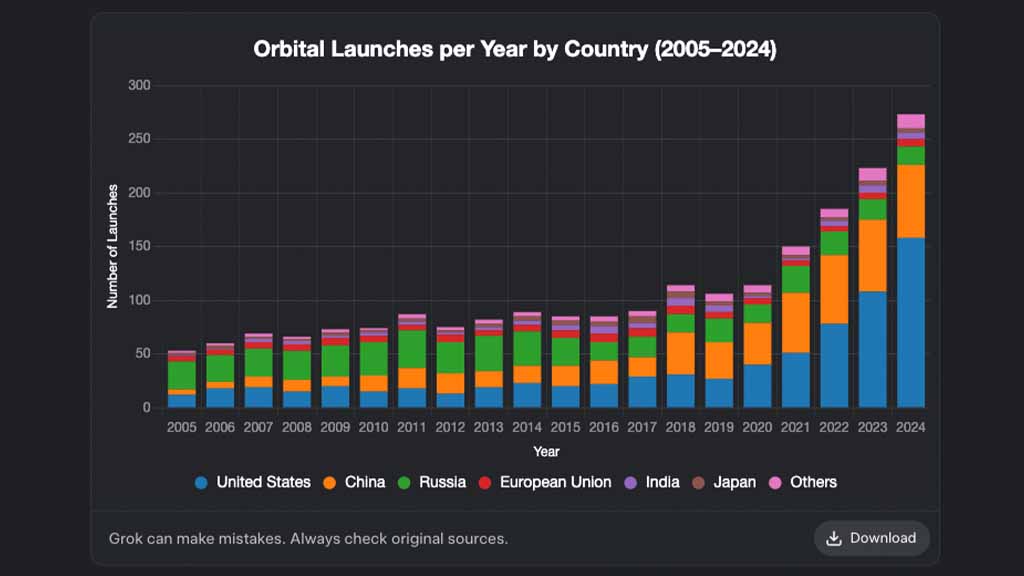
Type in a prompt such as “How many orbital rocket launches each country conducted from 2020 to 2025, show via chart. Once submitted, Grok will get on to the task and start generating the data.
It will also share an explanation for the metrics while providing interactions such as mouse hovering. You can download the chart in PNG format to share it with anyone. Interestingly, you can try different sorts of charts, including pie charts, line charts, doughnut charts and more.
Based on early user feedback, the feature wasn’t generating charts, which later received a fix. Still, there’s a chance that users may see this issue appear randomly before it is fully patched for wide compatibility.
This is part of xAI’s growing list of features for helping users to get more productive with this AI tool. You can access the Grok charts feature on the grok.com website.