xAI
xAI Grok will get Finance feature with tailored stock information

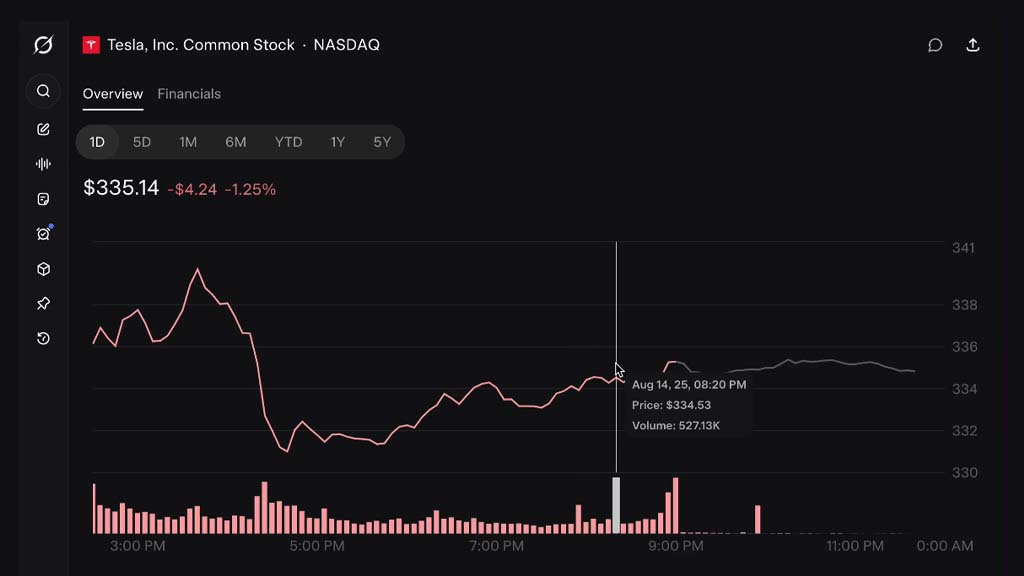
xAI is rapidly adding new features for Grok users, and another major addition is soon landing for those who like to stay updated with Finance and stocks. This feature has a full-blown interface, including two tabs – Overview and Financials.
Overview
This section gives you a real-time overview of the selected stock displayed with a line graph, consisting of price fluctuations over time. You can switch between 1 day, 5 days, 1 month, 6 months, year-to-date, 1 year, and 5-year performance graphs.
You can hover the mouse over the graph to see the date, price, and volume at a specific point in time. Below the graph, you will see a bunch of stock data, followed by related stocks.
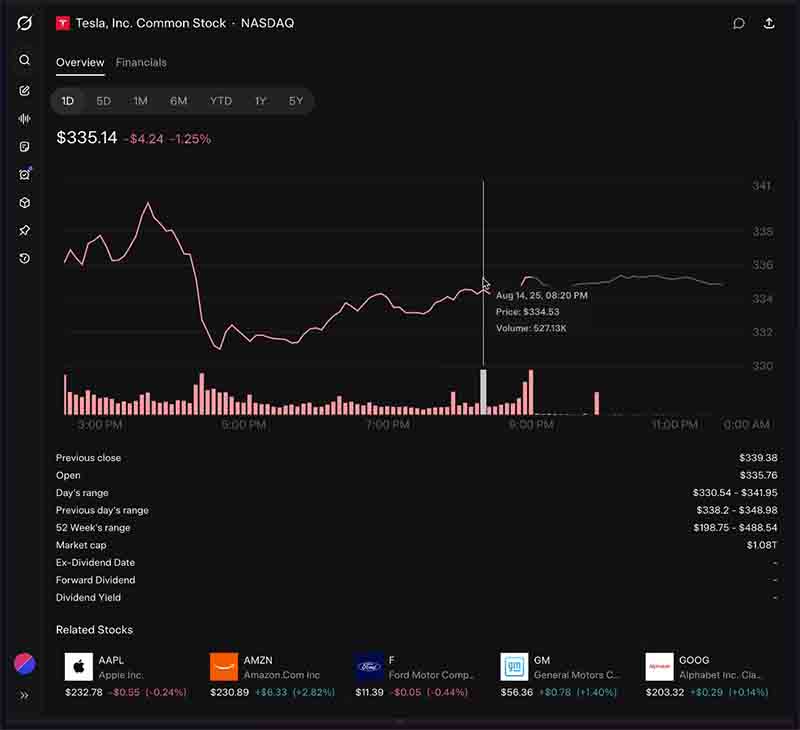
Grok Finance Overview (Source – Techdevnotes/X)
Financial
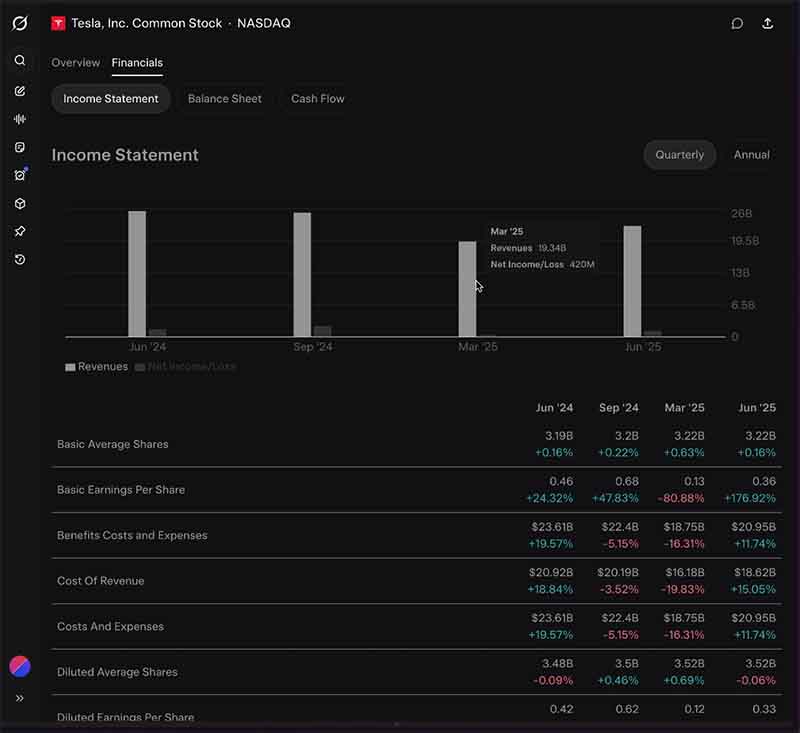
This tab is dedicated to detailed breakdowns of the company’s financial health, divided into three sub-sections – Income statement, Balance sheet, and Cash flow.
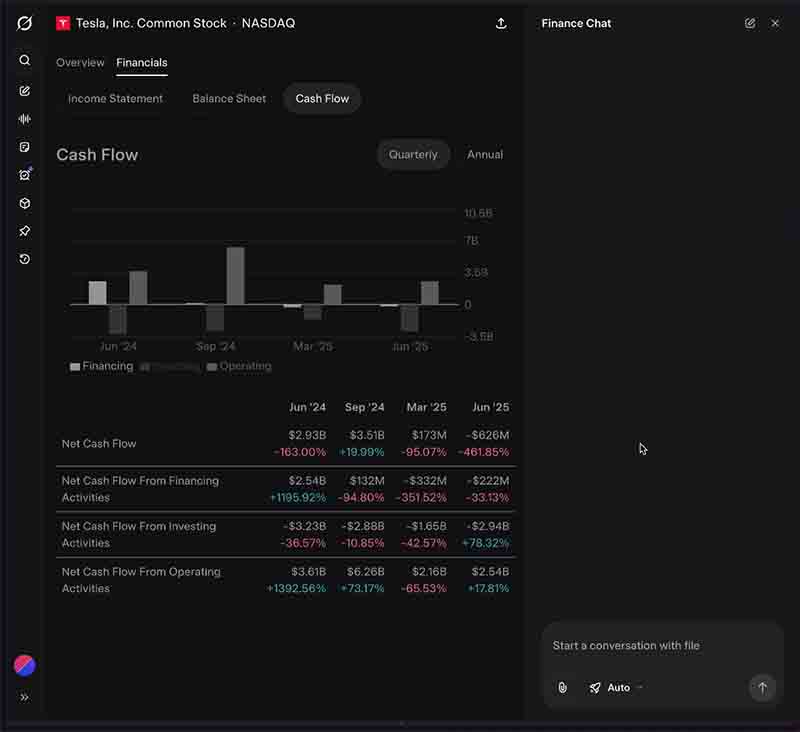
The income statement has a visual bar chart to show key metrics such as revenue quarter or annual. You will see a table listing to show various data, including revenue, gross profit, operating Income, Net Income, earnings per Share, as well as values for recent quarters. Similarly, the Balance Sheet and Cash Flow also show their dedicated data.
Chat with Grok
Users will have an option to conduct a financial conversation with Grok with a button in the top right to open the chat window. This will help them to understand any specific segment of the stock and how it’s performing in the current scenario, while also making a comparison.
(Source – Techdevnotes/X)
Availability
The user interface for the Grok Finance section is pretty clean, and everything looks fine-tuned for maximum visibility. According to the TechDevNotes, this feature is still under development and will rollout soon for users on the Web platform.